Manipulating Graphs
The following tabs all contain the option to display the results for an audit line in a graphical format:
- GP Analysis
- Incidence
- Prevalence
- Age Sex
Graph Menu
Select Graph from the Clinical Audit toolbar:
- Fit to Graph - If you have zoomed in on a graph, select to restore normal view.
- Fix Axes - Select to fix the axes of the graph you are viewing. This applies even if you change the criteria of the graph.
- Toggle Style - Select to change between column charts and line graphs.
- Properties - Select to update the way your graph displays, for example, different colours and label styles.
- Print Preview - Select to see how the graph prints.
- Print - Select to print the graph.
- Show Net (Incidence tab only) - Select to switch the display to show either the total (net) change or both the increases and decreases.
- Show Sexes Together, Show Sexes Separately, Show Male Only, Show Female Only (Age Sex tab only) - Select to change how the age sex graph displays.
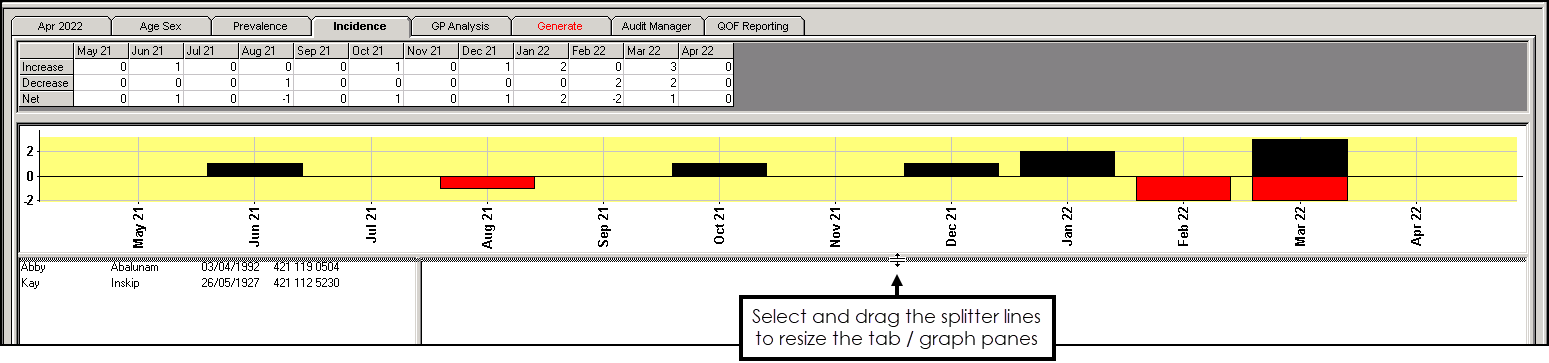
Additional Options
- Splitter Bar - Select and drag splitter lines to resize the tab / graph panes:
- Tabs - To display or hide the tabs at the bottom of the screen select Show Tabs
 / Hide Tabs
  from the toolbar.
Note - To print this topic select Print  in the top right corner and follow the on-screen prompts.