Age Sex Tab
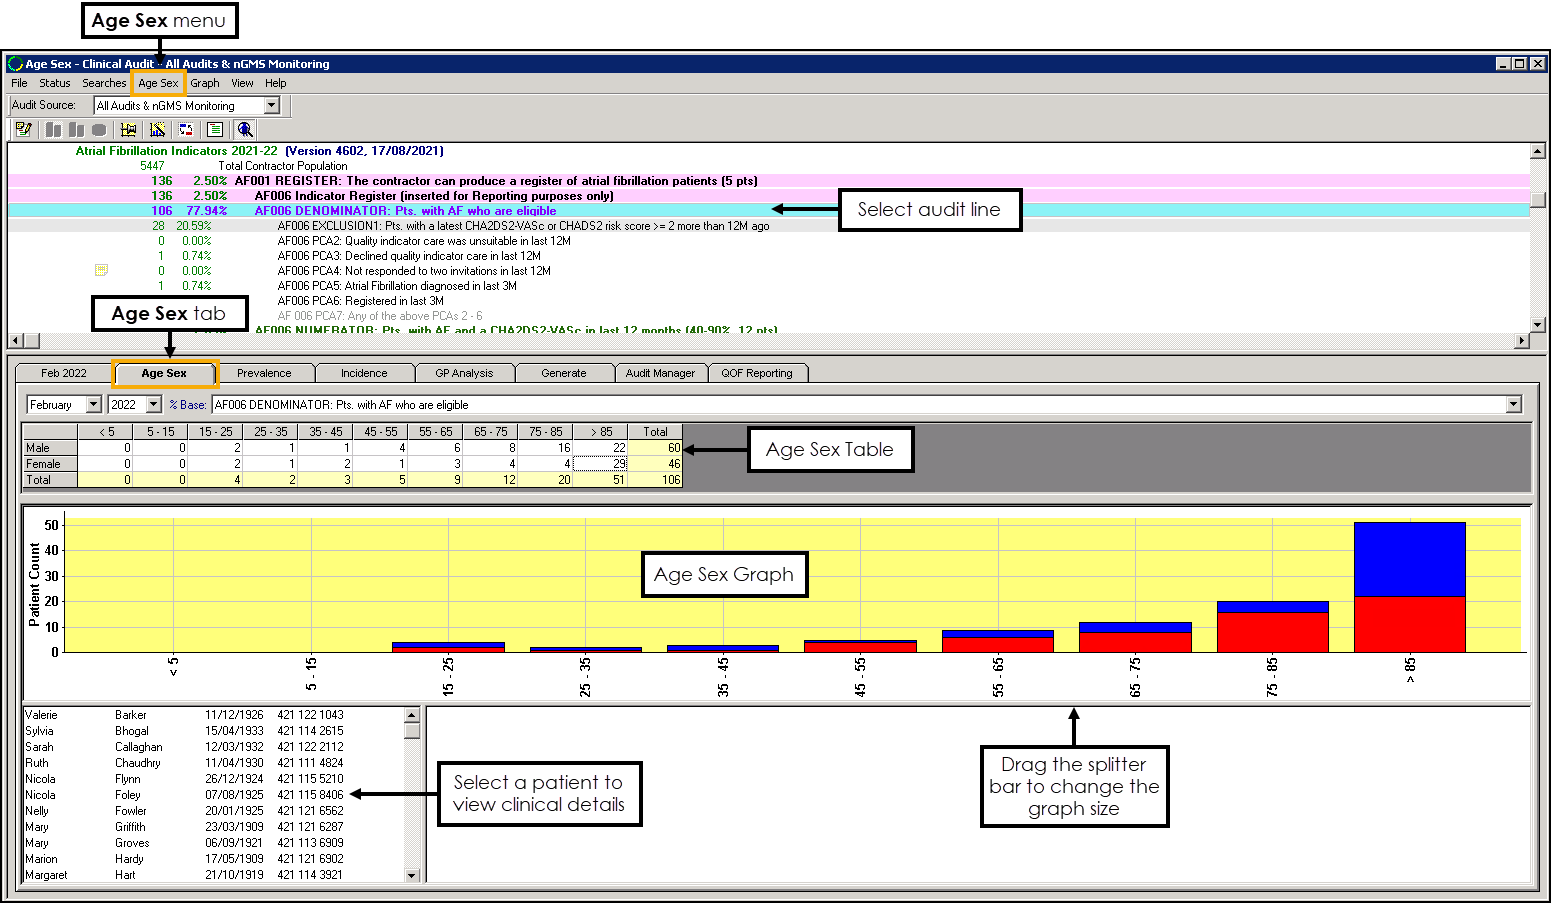
The Age Sex tab displays the distribution of patients in the selected audit line by their age and sex. Highlight the audit line required and then select the Age Sex tab in the bottom section. The Age Sex tab displays:
-
A table of the patient count by their age and sex.
-
A graph of the patient count for each age band.
-
A list of patients included.

Age Sex Table

To select the data to display:
-
Select the month and year required, from the available list.
-
Select the % Base.
-
Highlight a patient count to view the patient list below the graph.
-
Right click anywhere on the table to change the age bands or copy the table to your Windows clipboard.
Age Sex Graph

The Age Sex graph displays the Patient Count for each age band, male patients display in red and female patients in blue.
To view the age band and access the option to View Patients, right click on the area of the graph desired. The relevant information displays in the bottom left pane.
Additional Menu Options
Toolbar
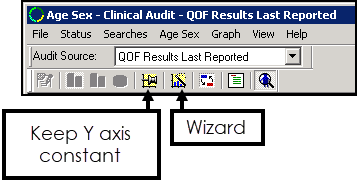
Selecting the Age Sex tab activates the Age Sex and Graph menus, along with additional items on the toolbar:

-
 Keep Y Axis Constant - When active, the axis of the graph you are viewing remains fixed, even if you change the criteria of the graph.
 -
 Age Sex Wizard - Select different styles of column charts or line graphs and also percentage adjustment options for Age Sex. See Age Sex Wizard for more details.
Age Sex Menu
Select the Age Sex menu to view the following options:
- Show Patients - Selected by default, displays patients for the active line in the bottom left pane, remove the tick to hide the list.
- Select from:
- Counts - Selected by default, select to display the Age Sex graph by patient numbers in the audit group.
- Percents - Select to display the Age Sex graph by percentage of base population.
- Percents adjusted for Sex bias - Select to display Age Sex graph by percentage within one sex only. For example, this takes all the male patients and displays their percentage by age, as oppose to the proportional representation of the whole group:

- Percents adjusted for Age bias - Select to display Age Sex graph by percentage within each age group, so you can see the proportion of male and female patients:

- Percents adjusted for Age and Sex Bias - This is active if the base population selected in %Base is different from that on the audit group.
- Previous Base Population - Select the higher level base population for the Age Sex graph.
- Next Base Population - Select the next lower level base population for the Age Sex graph.
- Export Results - Export in CSV (Microsoft Excel) format.
Graph Menu
- Fit to Graph - If you have zoomed in on a graph, select to restore normal view.
- Fix Axes - Select to fix the axes of the graph you are viewing. This applies even if you change the criteria of the graph.
- Toggle Style - Select to change between column charts and line graphs.
- Properties - Select to update the way your graph displays, for example, different colours and label styles.
- Print Preview - Select to see how the graph prints.
- Print - Select to print the graph.
- Show Net (Incidence tab only) - Select to switch the display to show either the total (net) change or both the increases and decreases.
- Show Sexes Together, Show Sexes Separately, Show Male Only, Show Female Only (Age Sex tab only) - Select to change how the age sex graph displays.
Viewing Patients
To display a list of patients in a specific section, right click on the section of the graph required and select View Patients. The list displays in the bottom left section of the screen.
Select a patient to view their qualifying clinical details, or right click to access the following options:
- No Sort - Select to remove any sorting on the list.
- Sort Patients by Surname - Select to sort the patient list by surname (A-Z).
- Sort Patients by Date of Birth - Select to sort the patient list by date of birth (eldest - youngest).
- Reverse Sort - Select to reverse the order of the patient list, for example, if the list is currently sorted by surname (A-Z) select Reverse Sort to sort by surname (Z-A).
- Print this Group - Select to print the patient list.See Printing a Patient List for details.
- Save This Group - Select to save the patient list as a Vision 3 Patient Group:

In Name enter a name for your group and select OK.
Note - The Description automatically populates with the information from the audit line.Training Tip - All Clinical Audits automatically save as groups within Patient Groups.See the Patient Groups Help Centre for details. - Copy - Select to copy the patient list to your Windows clipboard.
- Open Consultation Mgr - Select to open the selected patient's record in Consultation Manager.See Getting Started in the Consultation Manager Help Centre for details.