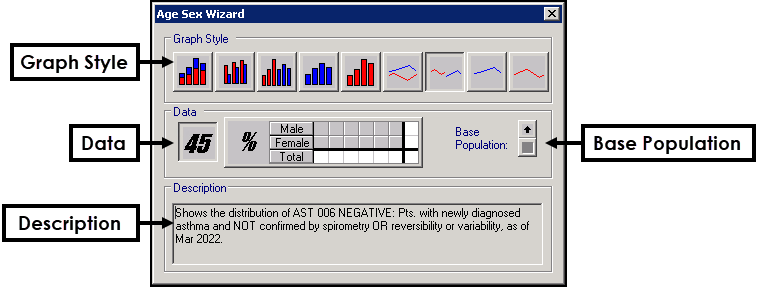
Age Sex Wizard
The Age Sex Wizard allows you to change the way your data displays in the Age Sex tab.
To display or hide the wizard, select Wizard  from the Clinical Audit toolbar. The wizard can be moved around your screen by selecting the top bar, dragging and dropping as required.
To change the way your data displays in the Age Sex tab, select from:

- Graph Style - Select from:
- Column charts - Stacked, Side by side, All Female and All Males, Females only, Males only.
- Line Graphs - Comparison, All Female and All Males, Females only, Males only. Training Tip - Males display in red and females display in blue.
- Column charts - Stacked, Side by side, All Female and All Males, Females only, Males only.
- Data - Displays by either a count or percentage. Select 45 to view as Counts, or select % to view the Percentages:
- Base Population - Relates to the percentages, select from:
 - To view the percentages for the selected audit line.
 - To view the percentage compared to the parent audit group.
 - To view the percentage compared to the entire practice population.
- Base Population - Relates to the percentages, select from:
- Description - Displays the Description of the selected audit line.
These changes can also be made from the Age Sex menu.
See Age Sex Tab for more details.
Note - To print this topic select Print  in the top right corner and follow the on-screen prompts.