Services Overview
The Services Overview screen displays an easy to follow overview of all services in your Pharmacy Intelligence Hub.

Filtering the Services Overview Screen
To filter the data that displays on the Services Overview screen by store, simply select the required store from Filter by store.

To view data for multiple stores, select the individual stores required and the stores display at the top of the list.

 to remove the store from the filter.
Headline
The Services Overview headline provides a real time summary of the number of services delivered, income from the current month and the values for the same month last year.

Navigating the Services Overview Screen
The Services Overview screen includes the following information:
The Income at Risk section covers services where income is at risk:
PFS Referrals Over 48hrs displays the number of referrals that are Active, 48 hours after creation date and their potential value.

 to open the Pharmacy First - Active screen.
NMS At Risk displays the number, and potential value, of NMS consultations that are in the Follow Up stage with more than 19 days since the completion of the Intervention stage.

 to open the New Medicine Service (NMS) Active screen.
The Services Income graph displays the income generated through clinical services delivered by your stores. It shows year on year and industry average comparisons.
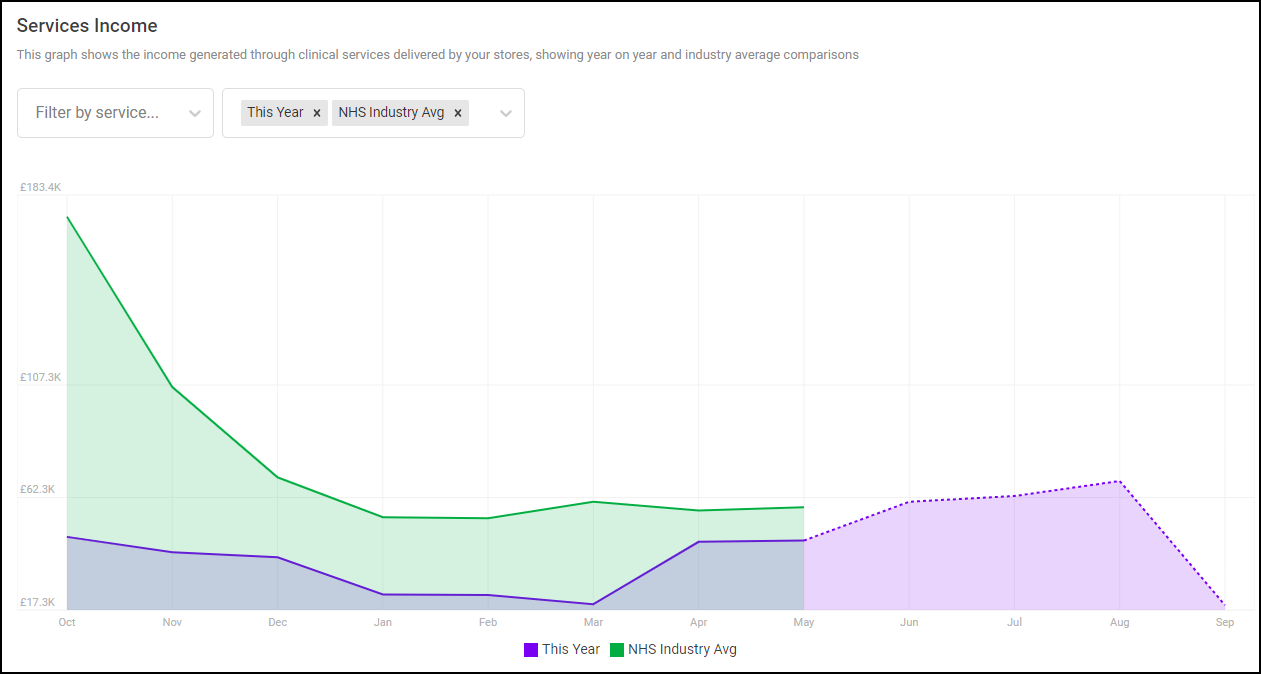
Cegedim Rx Ltd uses the income data published by the NHS Business Services Authority (BSA), where available. Where data is unavailable from NHS BSA, Pharmacy Services data is used to provide a real-time view of your income.
Filter the services and data that display by selecting from Filter by service and Filter data.

Select  to remove an item from the filter.

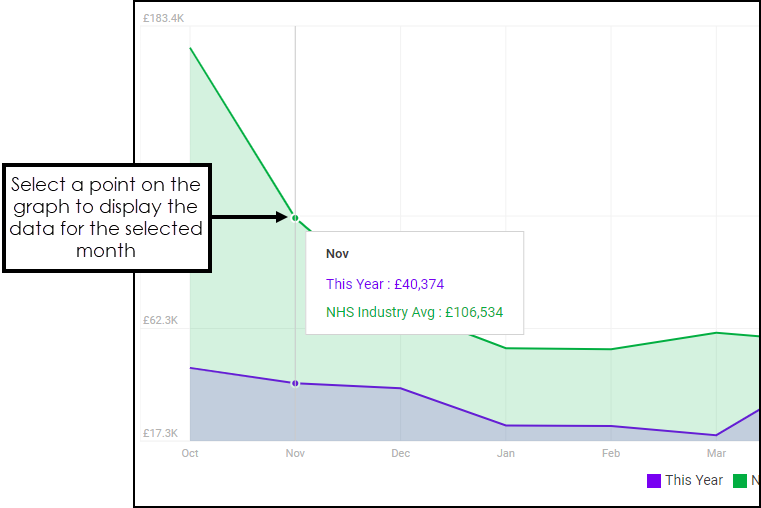
Select a point on the graph to display the income data for the selected month in a tooltip alongside it.
The NMS section displays the following:
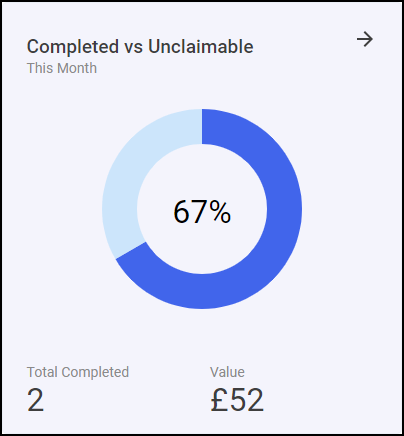
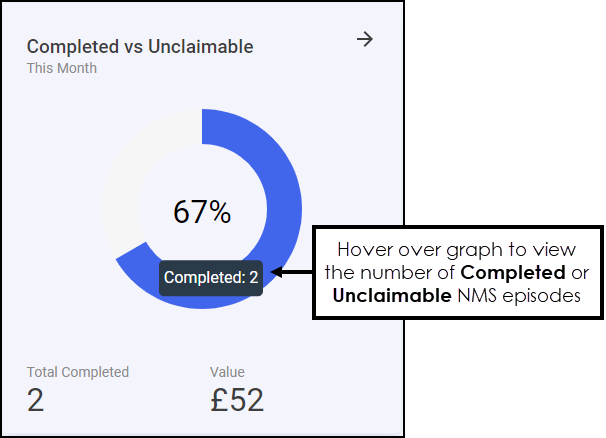
The Completed vs Unclaimable tile displays the number and value of completed NMS episodes with a graph displaying the number of Completed and the number of Unclaimable NMS episodes. Hover over the graph to display the quantities in a tooltip.
 to open the New Medicine Service (NMS) Completed screen.
NMS Active displays a summary of the number and potential income for active New Medicine Service (NMS) referrals across your group.
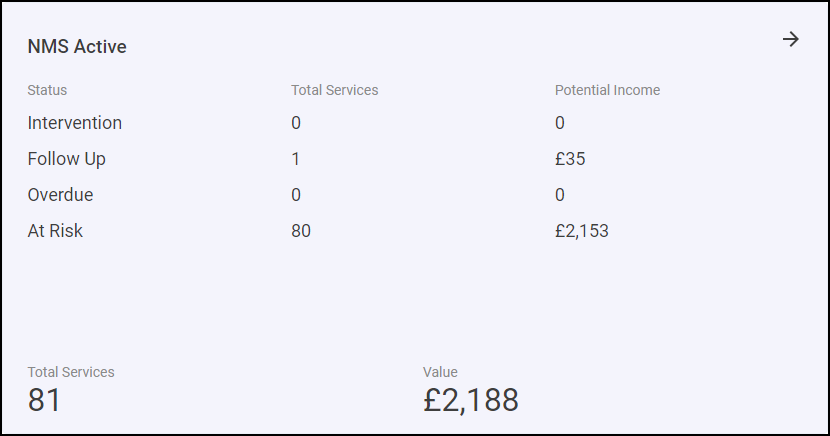
 to open the New Medicine Service (NMS) Active screen.
The Pharmacy First Service section displays the following:
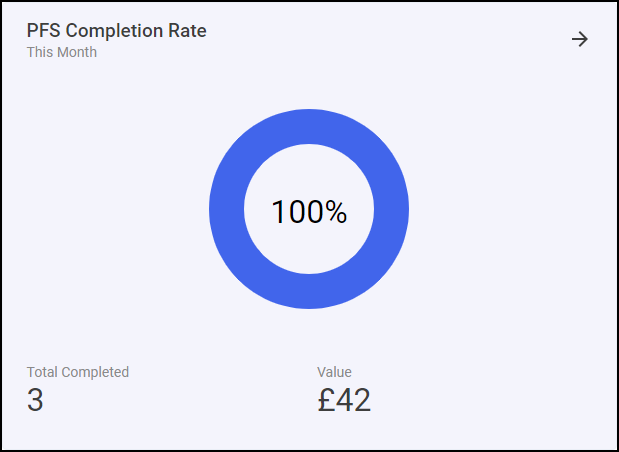
The PFS Completion Rate tile displays the number and value of completed Pharmacy First referrals with a graph displaying the number of Completed and the number of Unclaimable referrals. Hover over the graph to display the quantities in a tooltip.
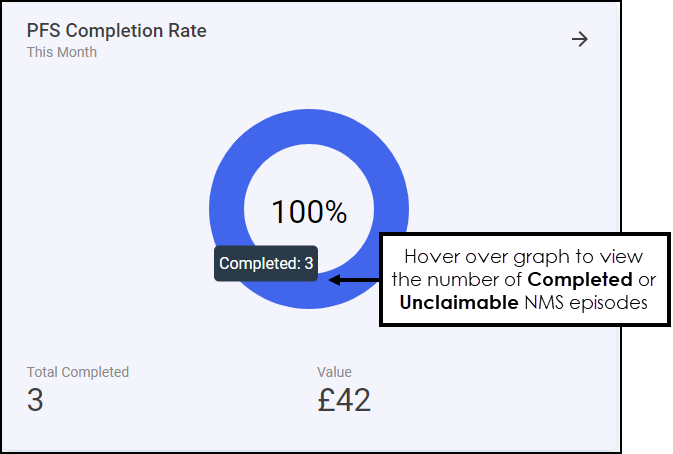
 to open the Pharmacy First - Completed screen.
Active PFS displays the number, and potential value, of active Pharmacy First referrals across your group.

 to open the Pharmacy First - Active screen.
The PFS Acknowledgement Time tile displays a monthly average of the response time between a Pharmacy First referral arriving at the store and it being opened.

 to open the Pharmacy First - Completed screen.
The Hypertension Case-Finding Service section displays the following:
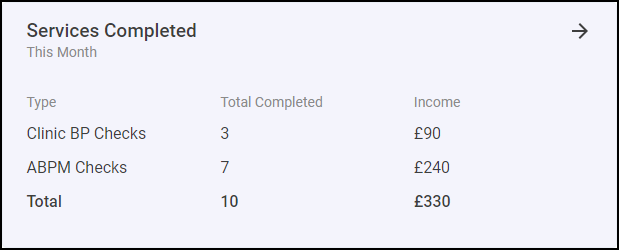
The Services Completed tile displays the number of Clinic BP Checks and ABPM Checks completed during the current month and the potential income.
The Pharmacy Contraception Service section displays the following:

The Services Completed tile displays the number of Pharmacy Contraception Services initiated and ongoing during the current month and the potential income from the service.
The Flu Vaccination Service section displays the following.
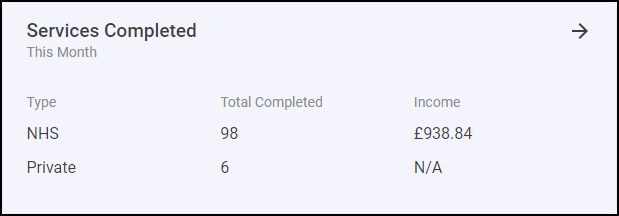
The Services Completed tile displays a summary of completed NHS and private flu vaccinations and their income across all stores in your group in the current month.
 to open the Flu Vaccinations Completed screen.