Guidelines - Adding a Patient Data Grid
From the Floating Toolbar, Add a Patient Data Grid  , allows you to either:
-
Create your own data grid, or
-
Place a data grid within another Guideline.
To add a Patient Data Grid to a Guideline:
- From the Guideline required, in Maintenance mode
 , click on the Guideline where you want to place the new data grid, or if a new guideline, at the top line.
 - Select Patient Data Grid and the Patient Data Grid screen displays:
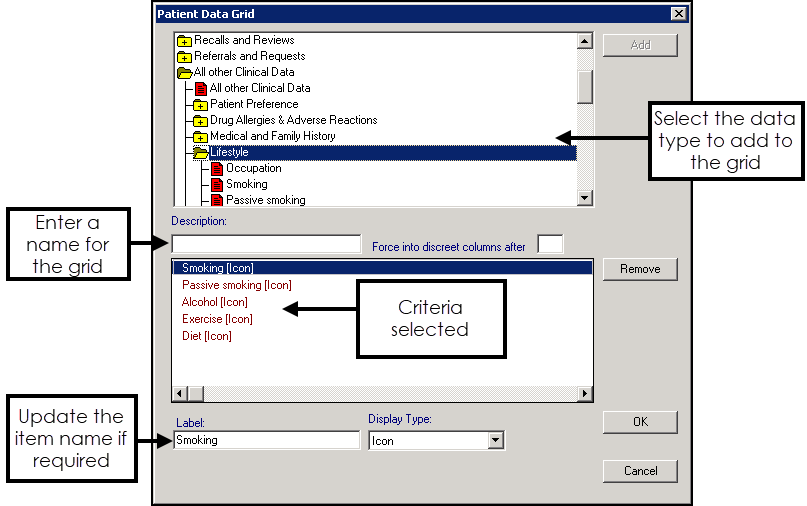
- Complete as required:
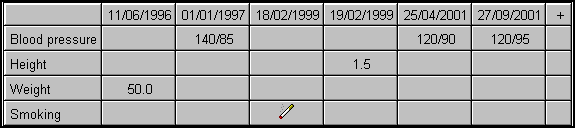
- Use the top pane to select the data type required, in the order you want them to appear on the grid. For example, for a 'Smoking' line, select All other Clinical Data - Lifestyle - Smoking, and then select Add. It now displays in the bottom pane. Repeat for all the entries you require in your grid. Note - If you select an incorrect item, highlight it and select Remove.
- Description - Enter a title for the grid you are designing.
- Force into discreet columns after - Select a time period to hide old entries, for instance, maternity might be forced into nine or eleven months, so enter 11M. Test results you might want to view on a daily basis, so enter 1D. The data grid displays the most recent entries fitting into that time frame in single columns.
- Label - Highlight each data line in the bottom pane to check the title to display on the grid line, update if required.
- Display Type - Select the way the data displays within the grid, the choice is Icon, Value (displays the actual numerical value, useful for test results), Standard Format, Short Format, Long Format, Interpreted Qualifier (for example, high, medium or low), Special Format.
- Special format - This allows you to write your own format screen with your own text in an additional text screen. This could be useful, for example, where you want to have two rows of the same data but with different qualifiers, for example, Normal on one and Abnormal on the other. For example, If you want the BMI to appear as a separate line on your data grid, add the weight line to your grid twice. On one of these lines, change the display type to Special Format, then in Format you need to enter *WEIGHT+BMI. Now edit Label to 'BMI'. Your data grid should now display a line headed 'BMI' and contain the BMI calculated field as well as the 'Weight' line.
 Hints on using Special Format:
The above example showed how you can use Special Format to display data that is otherwise hidden (in that case BMI), provided you know what formula to enter in the box.
*SCORE+NUMERIC1 displays the contents of the NUMERIC1 field of the Scoring test results entity.
There are other things you can do, precede a field with a customised label or limit the display length of the field.
*WAIST+WAIST_cm+"CM" displays the waist circumference value with the text 'cm' after it.
Suppose you want to write a Guideline to computerise the paper forms used for warfarin monitoring. This could include a table with date, INR, dose and next appointment in rows or columns. Showing the INR result and a recall date in a data grid is easy. But to show the recommended dose you need to enter '*RATIO_NORM+" "+(+TEXT+@L20)' in Special Format:
This picks out the Text attribute and limits the display length of this to 20 characters.
There is some logic in compiling special formats, they always begin with * followed by the Mnemonic of the entity, hence *RATIO_NORM+.
If you want any text to appear in the grid, enclose this in double quotes. The above example contains " " a space enclosed in quotes. This is simply because if you choose a free text field and there is no recorded comment, the system displays the format line instead and it looks odd. The free text comments are pre-fixed with a space, but the grid just appears blank if there is no comment.
The last section is the Attribute Mnemonic, the name of the field you want to pick out from this entity, in this case 'TEXT'. The additional bit @L20 is to limit the display length of the field to the specified number of characters. Whilst this is not normally required if you are including a free text field, the individual column might take up the whole screen if you don't apply some restriction. Any additional text displays by hovering the mouse over the entry.
One way to find out the mnemonic of a field quickly is to right click on it whilst holding down CTRL on your keyboard. This displays the attribute properties, one of which is the mnemonic, although this does not help with some, for example, calculated fields such as BMI.
- Special format - This allows you to write your own format screen with your own text in an additional text screen. This could be useful, for example, where you want to have two rows of the same data but with different qualifiers, for example, Normal on one and Abnormal on the other. For example, If you want the BMI to appear as a separate line on your data grid, add the weight line to your grid twice. On one of these lines, change the display type to Special Format, then in Format you need to enter *WEIGHT+BMI. Now edit Label to 'BMI'. Your data grid should now display a line headed 'BMI' and contain the BMI calculated field as well as the 'Weight' line.
- Use the top pane to select the data type required, in the order you want them to appear on the grid. For example, for a 'Smoking' line, select All other Clinical Data - Lifestyle - Smoking, and then select Add. It now displays in the bottom pane. Repeat for all the entries you require in your grid.
- Select OK to save.
Editing Patient Grids
To edit an existing grid:
-
From the Guideline required, select Maintenance mode
. -
Right click on the grid to update and select Edit.
-
Make the changes as detailed above.
-
Select OK to save.