Trends Tab
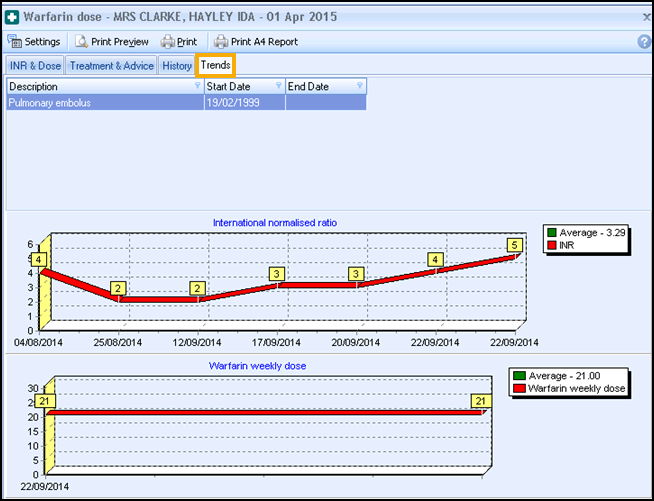
The Trends tab is a good visual aid for looking at a history of diagnostic indications along with their dates; it also shows the patients INR history and plots the weekly Warfarin dose with respect to time:

Note - By default the data shown in the INR and Warfarin graphs are relevant to the current diagnosis. To see the graph for other diagnosis indications highlight the relevant indication at the top of the screen.