Using Management Plans
Management Plans display a filtered section of a patient's record, according to category. One of the main advantages of Management Plans is that they display the episodes of data, particularly useful for maternity and test results.
Recorded data displays in a grid format:
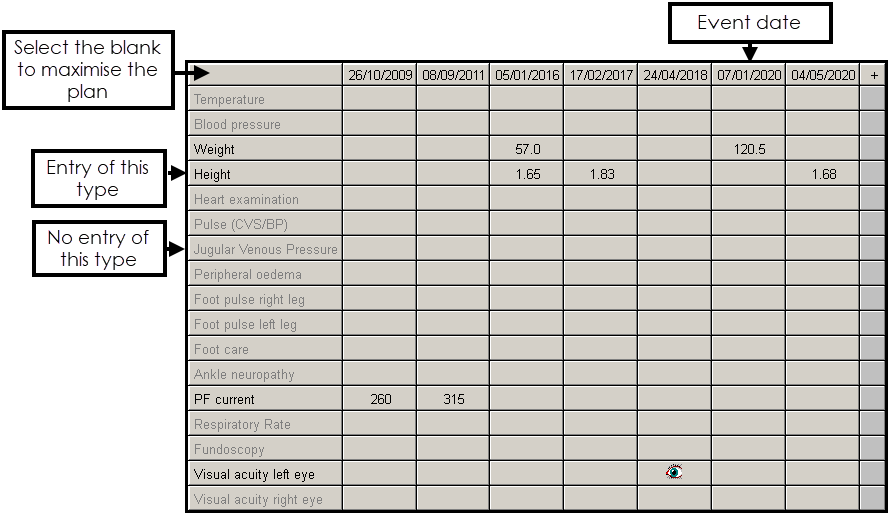
Once data is recorded, only rows with data display and those that are empty are hidden. Select the blank left cell on the top row to expand or minimise the grid.
In some cases, such as the Diabetic or Asthma Management Plan, there are several grids within the one plan under different headings of Review, Investigations and Treatment.
Each column represents the date of a single encounter with the patient, reading down the columns shows the data within that encounter. Reading across the rows shows the trend of data.
Where data is recorded, a symbol, text or value displays:
- If you point to one of these entries, the relevant data displays in a tooltip.
- Select the left or right arrows to display earlier or later data.
Right mouse click in the left-hand column to select:
- Suppress Empty Rows - To hide any empty rows which do not have data.
- Suppress Row - To hide the row you are pointing to.
- Restore all rows - To re-display all the hidden empty rows.
- Graph - To display a graph of data on that row, if plottable as a graph, for example, BP, weight, test results, see Displaying data as a Graph for more details.
- Add - To display an - Add screen for the row at which you are pointing.
- Restore All columns - To re-display any hidden columns, only available if you are pointing to the top header row.
- Suppress column - To hide the column selected, only available if you are pointing to the top header row.
You can also toggle restore or suppress rows by selecting the blank heading row.