Dispensing Statistics
The Dispensing Statistics screen displays the volume of prescription items labelled across your pharmacy group.
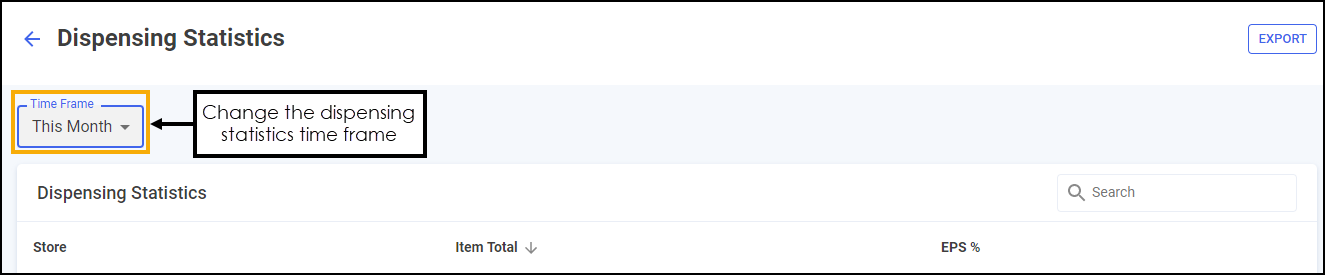
Time Frame
You can easily filter the data that displays on the Dispensing Statistics screen, select the date picker and then you can either select a pre-set time frame, for example, This Week or Last Month, or you can select a start date and end date to select a specific time frame.
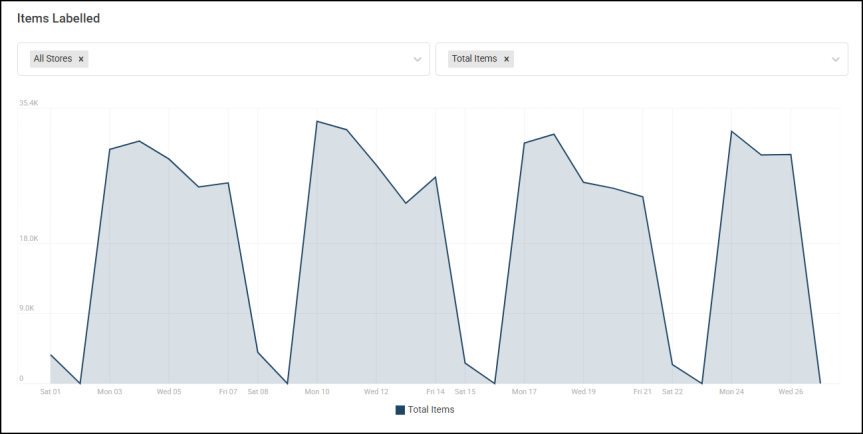
Dispensing Statistics Graph
The Items Labelled graph displays the total number of items labelled across all stores for the current month by default.
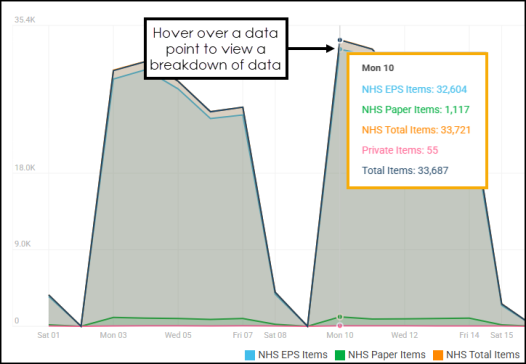
Hover over a data point on the graph to display a breakdown of data for that particular date.
Filtering Dispensing Statistics Graph Data
-
Filter by store - To filter the stores that display select the down arrow to view the filter options and select the stores required. You can select multiple stores.
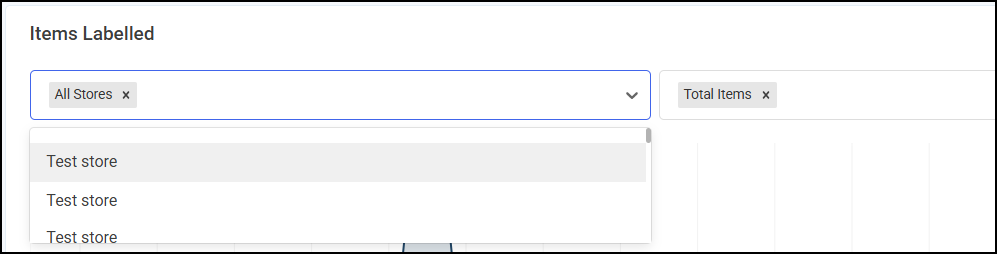 Training Tip - Select
 to remove a filter, for example, All Stores or an individual store.
 -
Filter by items - To filter the category of items that display select the down arrow to view the filter options and select category required. Multiple categories can be selected.
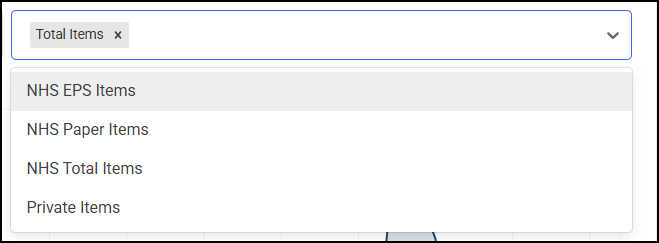 Training Tip - Select to remove a filter, such as Total Items or NHS Total Items.
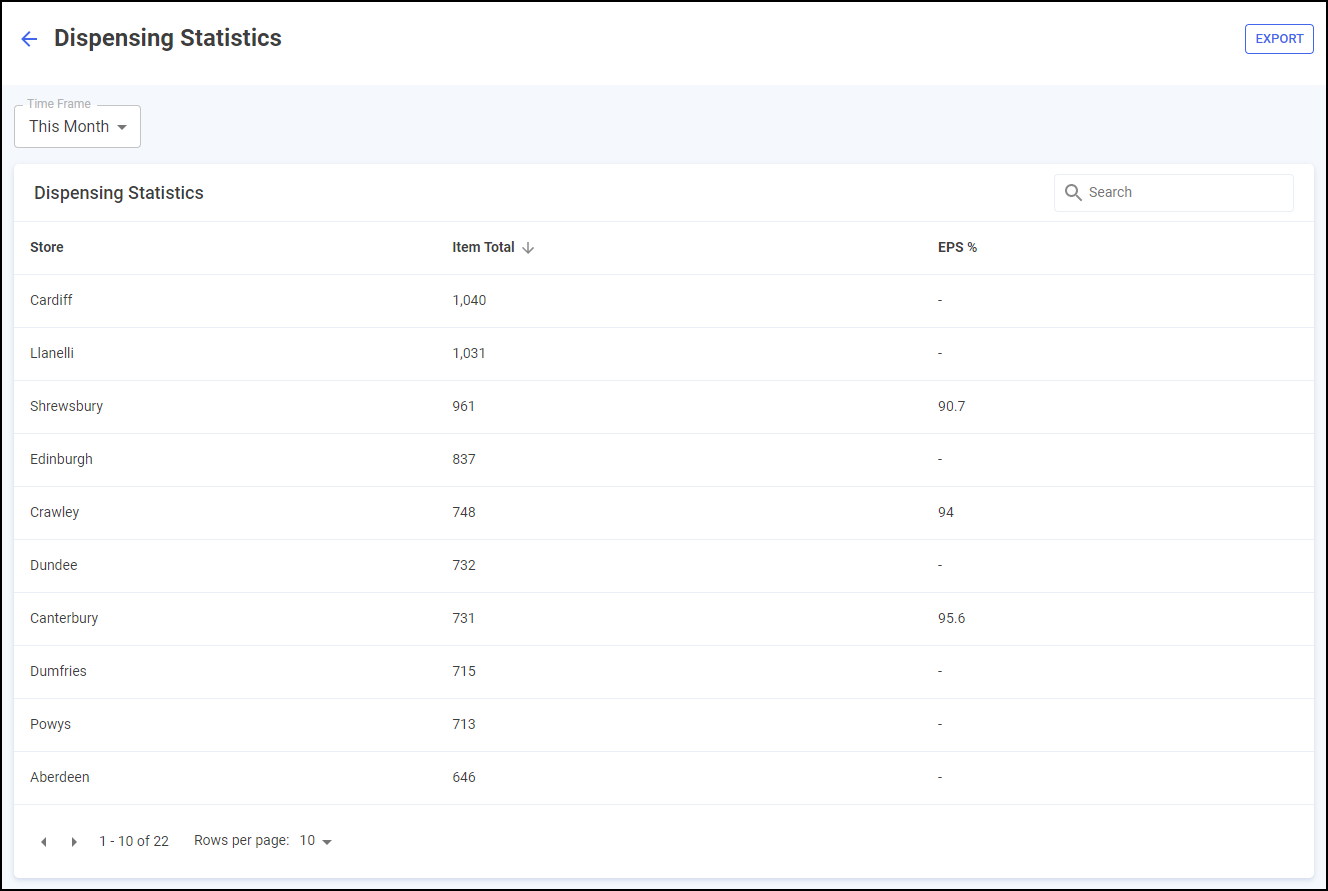
Dispensing Statistics Table
The Dispensing Statistics table displays additional information relating to the dispensing statistics of pharmacies across your group, in ranked order.
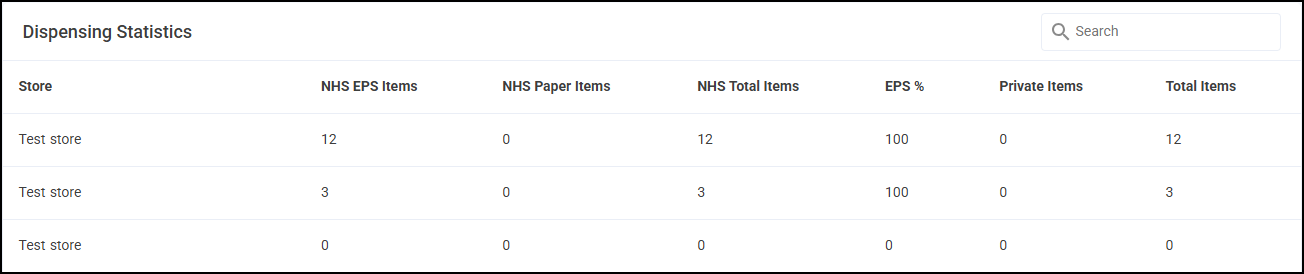
The Dispensing Statistics table displays the following:
-
Store - Displays the store name.
-
NHS EPS Items - Displays the number of NHS electronic items dispensed for this store.
-
NHS Paper Items - Displays the number of NHS paper items dispensed for this store.
-
NHS Total Items - Displays the number of NHS items, electronic and paper, dispensed for this store.
-
EPS % - Displays the percentage of EPS items dispensed for this store.
-
Private Items - Displays the number of private items dispensed for this store.
-
Total Items - Displays the total number of items dispensed for this store.
Sorting and Searching Dispensing Statistics Table Data
-
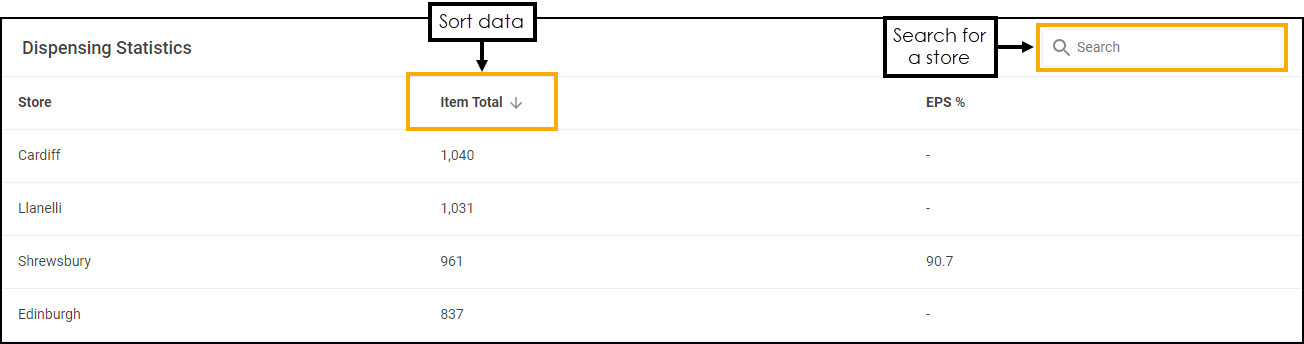
Search - To search for an individual store, enter the store name in Search
 , the table updates as you type.
 -
Sort Data - Select any header to sort pharmacies by the chosen header, for example, select Total Items to sort pharmacies by the highest/lowest number of total items.
Exporting Data
To export Dispensing Statistics data of your group to a CSV (spreadsheet) file:
-
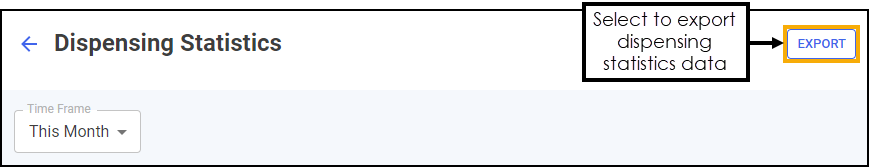
From the Dispensing Statistics screen, select EXPORT
 .
.
-
The Export screen displays.
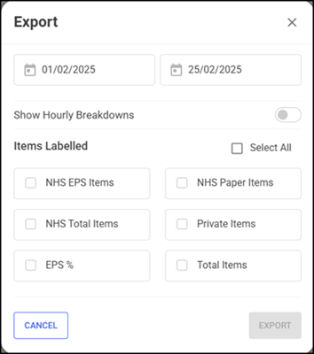
Select from the following:
-
From/To - Set the time frame for the export.
-
Show Hourly Breakdowns - Toggle on to export an hourly breakdown.
Important - Selecting hourly increments over an extended time frame produces a large data output and therefore takes longer to export. -
Items Labelled - Select the data to export. Tick individual options or choose from Select All to tick all available options.
-
-
Select EXPORT
 to export the CSV (spreadsheet) file to your local Downloads folder. Training Tip - To view the Downloads folder, open Windows File Explorer, locate and open Downloads. A list of your recently downloaded files display.