Data Grid
The Data Grid Widget uses a range of filters to display data by date and a combination of: Country, Organisation and/or Practice, this is the same as the large data grid used in Central Reporting.
Where practices are sharing Patient Identifiable Data, you can drill down to view this.
See - Patient Drilldown.
- From the Widget Gallery on the left, select Add next to the Data Grid Widget
 , or select the Widget and drag to the Dashboard.
- Optionally, drag the Widget to reposition.
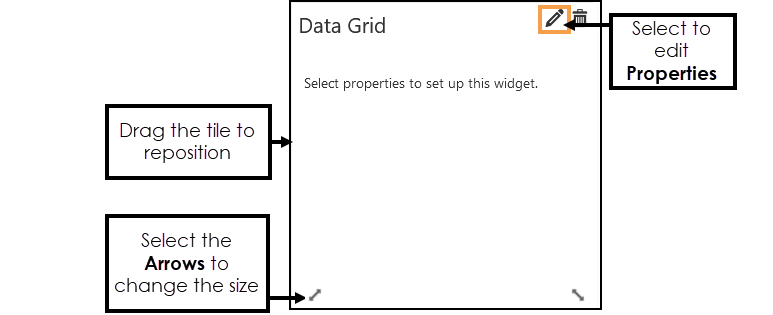
- Select Properties to set up the Widget.
The Data Grid Properties display.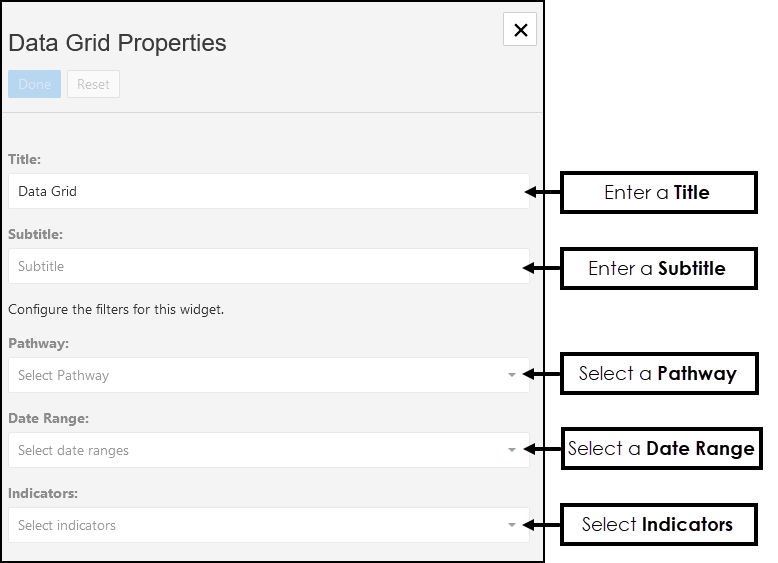
-
Enter a Title, if left blank this defaults to the name of the Pathway selected.
-
Optionally, enter a Subtitle.
-
From the drop-down list choose the Pathway you want to view data from.
- Optionally, from the drop-down list to choose a Date Range.
Note - The Date Ranges must be pre-set. See - Date Ranges.
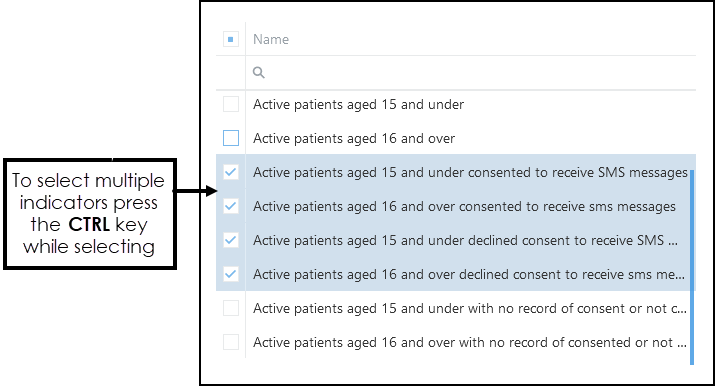
- Select from the Indicator drop-down list, to report on multiple lines press CTRL while selecting.
-
Optionally, select from the Practice drop-down list, to report on multiple practices press CTRL while selecting.
-
Optionally, select from the Countries drop-down to filter the results by country.
-
Optionally, select from the Organisations drop-down to filter the results by organisation.
-
Select Done to update the Properties and X to close.
The Data Grid displays, you may need to resize to view the full grid.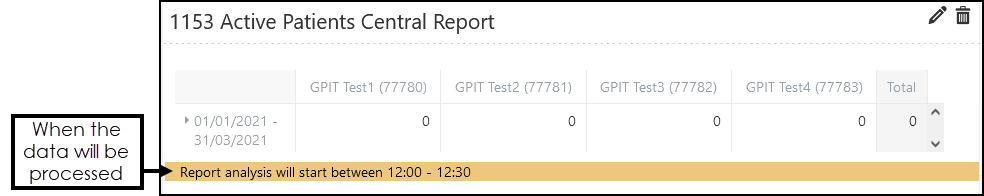 Note - An alert displays to indicate when the data will be processed.