Count Widget
The Count Widget performs a total for the selected Indicator, if this covers multiple dates the Widget displays as a slide show.
Note - The Date Ranges for your Dashboard must be set up before they can be selected within a Widget. See - Date Ranges.
- From the Widget Gallery on the left, select Add next to the Widget or select the Widget and drag to the Dashboard.
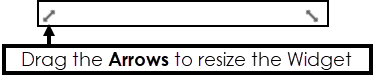
- Optionally, drag the Widget to reposition, or use the Arrows to change the size.
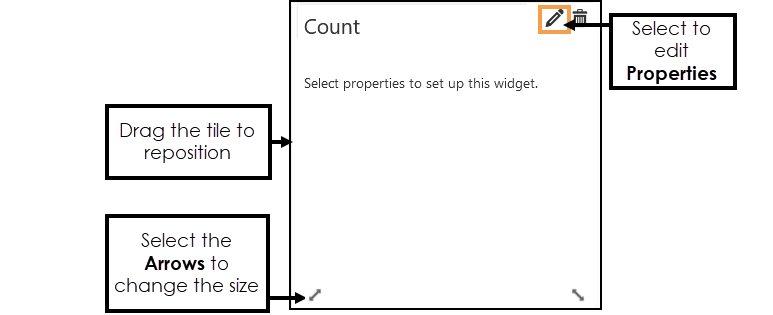
- Select Edit Widget to configure the Properties.
The Count Properties display.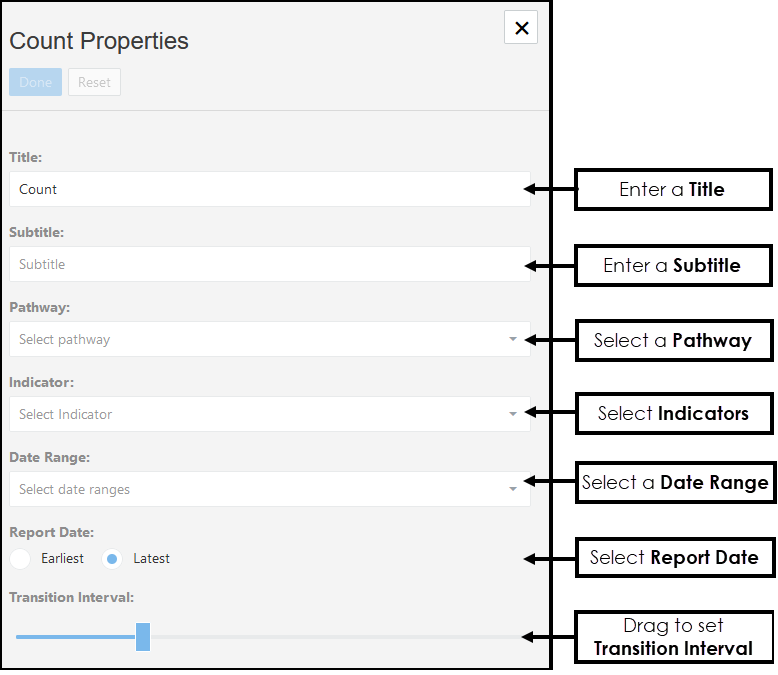
-
Enter a Title, if left blank this defaults to the name of the Pathway selected.
-
Optionally, enter a Subtitle.
-
From the drop-down list choose the Pathway you want to view data from.
-
Select the Indicator from the drop-down list.
- Optionally, from the drop-down list to choose a Date Range, and/or select a Report Date. Note - The Date Ranges must be pre-set. See - Date Ranges.
- If there are multiple extract dates, the Count displays as a slide show, drag the Slider to set the Transition Interval between the views.
Hover over the Slider to view the Transmission Interval.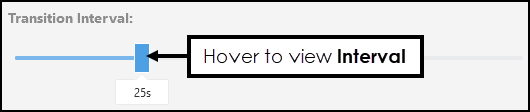
- Select Done to save and X to close the Properties.
The Widget displays. - Optionally, hover over the Widget to activate the Arrows, these can be used to resize the chart.