Create a Gauge Chart
Linear or Circular Gauge charts display data as a percentage and include options to set targets with an upper or lower limit.
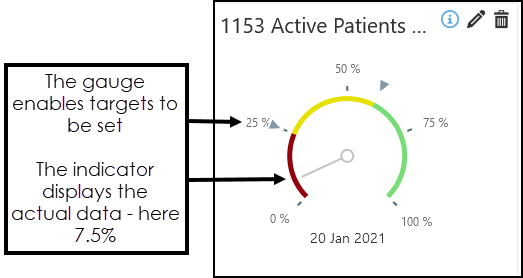
The targets use red, yellow and green to indicate progress.

The steps are the same for both the Linear and Circular Gauge.
To create a Linear or Circular Gauge:
- From the Widget Gallery on the left, select Add next to the Widget or select the Widget and drag to the Dashboard.
- Optionally, drag the Widget to reposition.
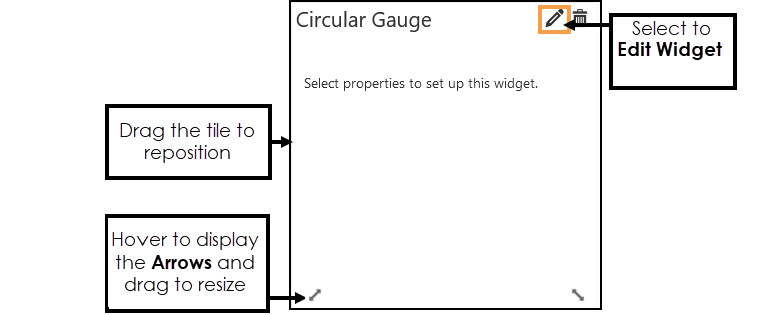
- Select Edit Widget to configure the Properties.
The Chart Properties display.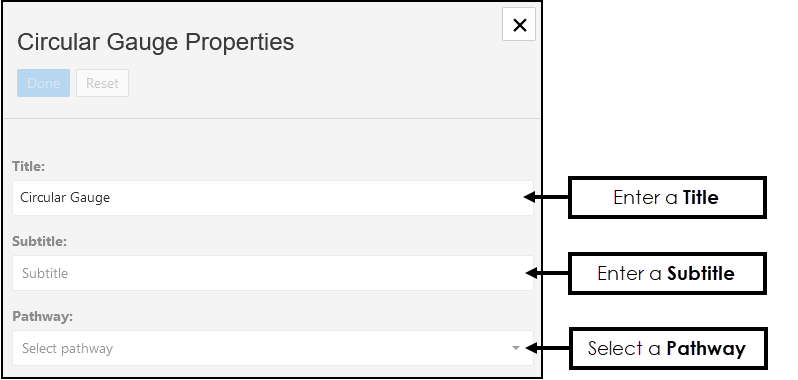
-
Enter a Title, if left blank this defaults to the name of the Pathway selected.
-
Optionally, enter a Subtitle.
-
From the drop-down list choose the Pathway you want to view data from.
-
Next, select the Upper Limit, this Indicator is used to set the threshold limit.
For example, if reporting on SMS Consent status for patients aged 16 or over, the Upper Limit Indicator would be all active patients over 16, then you can see what percentage of these have a recorded SMS Consent status.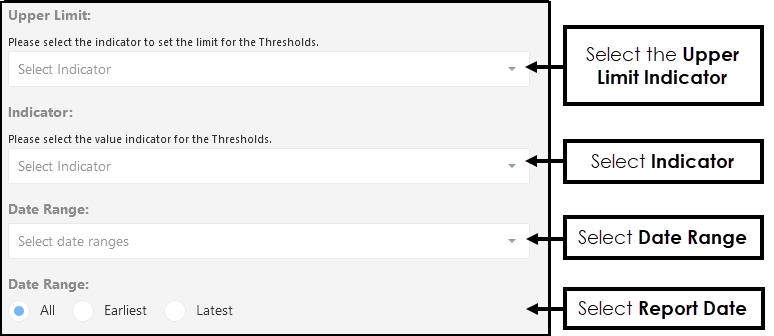
- Select the Indicator from the drop-down list, for example, Patients aged 16 and over consented to receive SMS.
- Optionally, from the drop-down list choose a Date Range, and/or select a Report Date. Note - The Date Ranges must be pre-set. See - Date Ranges.
- Select Lower Alarm Range or Upper Alarm Range.
- Lower Alarm Range - below the first alarm limit displays red and above the second alarm limit displays green.
- Upper Alarm Range - below the first alarm limit displays green and above the second alarm limit displays red.
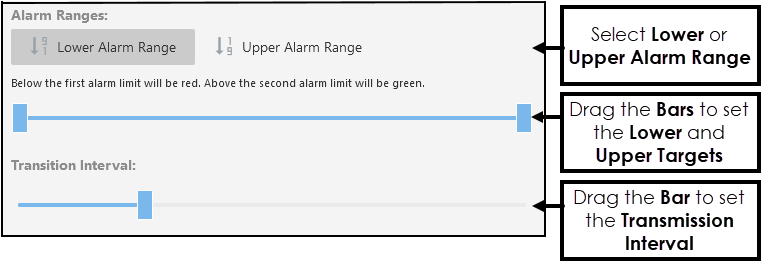
- Set the Lower or Upper Target by dragging the Bars,
Hover over the bar to display the percentage.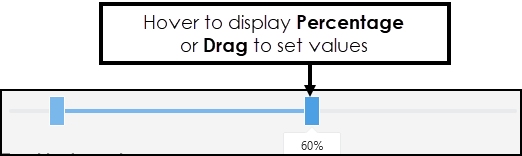
-
If the Date Range covers more than one extract the Gauge displays as a slide show.
To set the Transmission Interval, drag the bar to set the number of seconds between views. - Select Done to save and X to close the Properties.
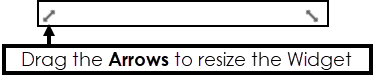
The Widget displays. - Hover over the Widget to activate the Arrows, these can be used to resize the chart.