|
|
|
|
|
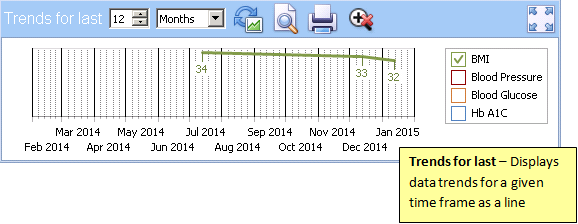
Trend Graph
Trend Graphs are available within each Apps screen. They provide a graphical representation of the data and can be customised to accommodate different date ranges and data:
Trend Graph
-
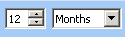 Changes the time frame displayed. Changing the months or years affects the start of the x-axis with the end always being today.
 -
 Refresh Graph - Updates the graph if data has been added or criteria changed
 -
 Print Preview - Displays a print preview
 -
 Print - Sends the graph to print
 -
 Reset Zoom - Resets the Zoom to standard
 -
 Maximise View - Select to view a larger version of the Trend Graph
 Training Tip - Hovering your mouse pointer over a point on a line, displays a tooltip giving the precise value of the record.