Timeline
The Timeline is a graphical representation of problems and history over time. This allows you to view at a glance the duration of particular problems and individual episodes where appropriate. The Timeline is an optional part of the Problem tab.
To display the Timeline as part of the Problems tab, from Consultations - Options - Setup - Patient Record select Initial View 8 or create your own Patient Record View, see Consultation Manager Setup - Patient Record and Creating your own Patient Record Views for details.
The Timeline is directly linked to the Problem tab, the problems that display on the timeline depend on your All Problems or Active problems selection from the Problem tab
The date axis represents a range from the earliest piece of data in any of the problems until the latest piece of data in any of the problems.
To use the Timeline:
- Drag and Drop - You can click, drag and drop entries from the selected patient record on to either the appropriate Problem on the Timeline or the New Problem section. The timeline accepts items dragged from the Consultation view, the Problem tab or the Journal.
- Date Range - To zoom in on the timeline, select a particular point just above the date line with the months and year, hold your click and drag the blue bar left or right, this indicates the extent of the new range, when you release the click, the axis snaps to the selected range. You can continue to zoom into the timeline until the axis covers less than one month. To restore the timeline to its full extent, select Full Timeline.
- New Problem - Select New Problem to create a new Problem.
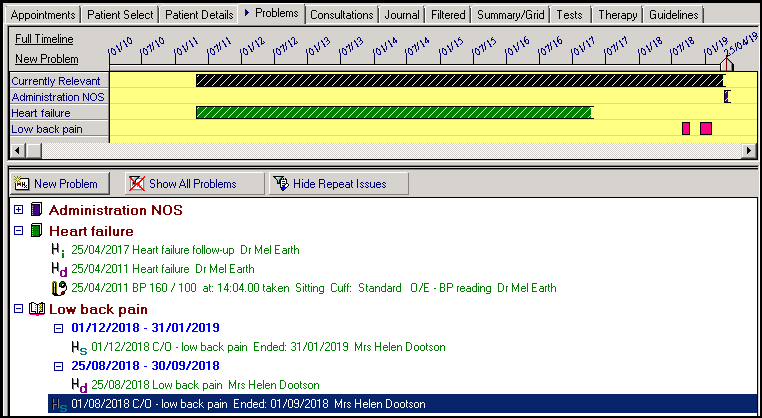
- Episodes - The selected patient's Problems are listed on the left-hand side and bars represent the dates and duration of episodes within that problem, the bars are colour-coded according to the Read chapter associated with the problem, see Episodes for further details.
- Pointed Ends
 - If the timeline has pointed ends it indicates that the Problem/Episode extends beyond the date range displayed in the direction(s) shown.
 - Closed episodes - Indicated by solid colour and closed ending.
- Open ended episodes
 - Indicated by solid colour and open ending
 - Open ended Problems (no episode)
 - Indicated by hatched colour and open ending.
Interactions between timeline and Problem view
The display of Problems in the Timeline view is dependent upon the selection of Active or All Problems on the Problem tab and is updated automatically.
- Select from the timeline to display your selection on the Problem tab.
- Select a Problem on the left of the timeline to expand the selected Problem and collapse all others.
- Select a specific spot on the timeline to expand the problem and episode relating to the date selected and collapse all other problems. The expanded episode is the episode containing an event on or prior to the date clicked, due to the limitations of scale, this is only approximate, but should get you there or thereabouts. If a particular episode cannot be expanded, then the problem is expanded but all episodes are collapsed, you may then expand the episode of interest. This feature allows you quickly to browse the data associated with a particular episode on the timeline.
Interactions between timeline and Journal view
The Timeline has a slider which indicates where in time the Journal displays. This is a two-way facility, you can change the dates you are viewing in Journal and the slider moves to that point in time, or you can move the slider in the Timeline and then view the Journal and it displays the selected timeframe. This can be a useful tool to view entries from a specific time quickly and easily.