|
|
|
|
|
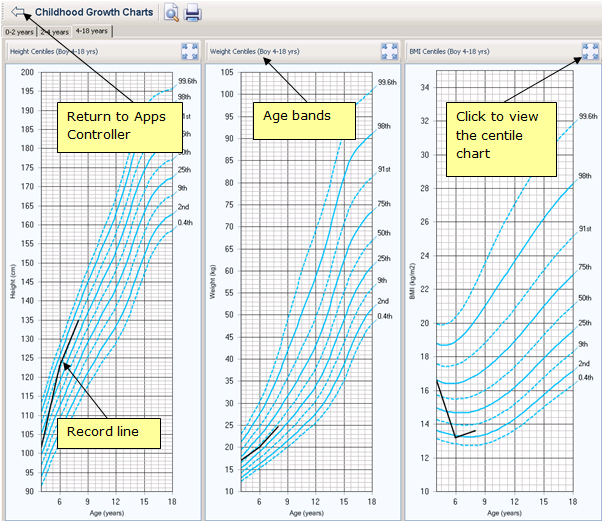
Childhood Growth Charts Screen
The  Childhood Growth Charts app displays a graph of childhood BMI's plotted against centiles for children between the ages of 5 and 19 years. The information used to plot the charts is based on UK data.
Childhood Growth Charts
The Childhood Growth Charts display multiple tabbed growth charts dependent upon the patient age.
The patient centile charts cover three different age ranges:
- 0-2 years
- 2-4 years
- 4-18 years
Within each age range there are centile charts for Height, Weight and BMI. The age ranges are shown on tabs and only those tabs relevant to the patient’s age are shown. Thus, for a patient aged three only the first two tabs are shown and the second selected by default.
To Use a Child Growth Chart
To add data:
- Right click on the graph required.
- Select either Add Height or Add Weight as required.
- Complete the Height - Add or Weight - Add screen in the usual way.
- Click OK to save and plot the value on the centile graph.
To edit an entry:
- Right click on the entry bullet required.
- Select Edit.
- Update the details as required.
- Click OK to save and close.
Additional chart functions:
- Click
 to view the selected graph as a larger pop-up
 - Right click to add data in the usual way.
- To zoom in on a section of a graph, hold the shift key and click and drag over the area you want to zoom in on. Release the mouse key to action.
- Click
 Reset Zoom to return to the full graph.