|
|
|
|
|
Graph
You can display graphs for the following numerical data:
Blood pressure, all test results, height, weight
From a line with one of the above (eg the List - Blood pressure, or Medical Records Overview), click with the right mouse and select Graph.
The dates of the results are given on the X-axis, and the relevant units on the Y-axis (eg BP reading, kilograms for weight etc).
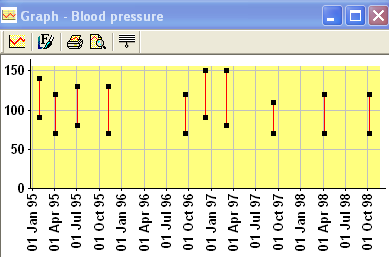
A graph of blood pressure readings - the area of the graph where there are readings has been expanded in order to view it more easily
Once the graph displays:
- Expand the area you are interested in by positioning the cursor to the left and above the area, holding down the left mouse and dragging the resulting square around that result. Let the mouse button go. The area will now be expanded.
-
 To revert to the way it was - ie unexpand it - use the Fit to Graph icon .
 -
 The Style icon changes the style of the graph. Change the colours of the Paper, Line, Grid, Tracker or Axes by clicking on the buttons and selecting from the colour palette. You can also alter the font of the column labels and the date format. The effect of any changes you make can be seen by clicking on Apply. If you click on Default, this will return the screen colours to the default values.
 - When you are finally satisfied, either click on OK so the graph style is changed for this session only, or first click on Save as Default so it is checked if you always want graphs displayed in the style you have just chosen.
-
 Print the graph out using the print icon.
 -
 Print Preview first before printing out.
 -
 Close graph and exit.